
Overview
The Investment Planning Studio in AIZOPlan offers a suite of dynamic dashboards that empower you to monitor, analyze, and optimize portfolio-level investments. These dashboards provide real-time visibility into budget performance, execution progress, and strategic alignment, enabling smarter investment decisions across your portfolios.
📌Accessing the Investment Planning Dashboard
To access the dashboards, open the Investment Planning Studio through one of the following paths:
- Option 1: From the main menu, navigate to
Portfolio → Plan → Investment Management Studio - Option 2: Open the Investment Planning Studio directly from the Portfolio Office.
Then, click on the Dashboard tab.

🗂️ Select Period and Portfolio
Begin by selecting the reporting period and target portfolio. All dashboard metrics and views will update based on your selection.
📈 Overview Dashboard
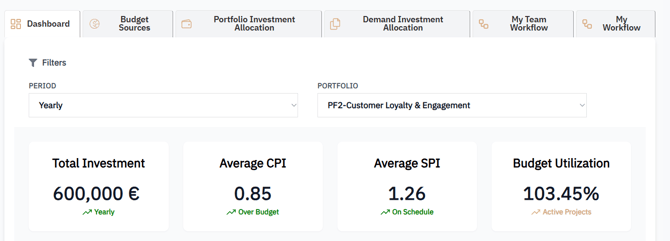
This summary dashboard offers a high-level view of core investment performance indicators:
-
Total Investment – Cumulative allocated investment for the selected portfolio
-
Average CPI – Cost Performance Index across projects
-
Average SPI – Schedule Performance Index across projects
-
Budget Utilization – % of budget consumed (actual vs. planned)
🔍 Portfolio Details View
Explore detailed performance metrics for each project in the portfolio:
-
Portfolio / Project Names
-
SPI – Measures schedule adherence per project
-
CPI – Assesses cost efficiency
-
Budget Utilization – Tracks budget consumption
-
Allocated Investment – Shows investment assigned to each project

📊 Investment Trend – Detailed View
Visualize how your portfolio’s financials evolve over time:
-
Budget – Planned investment
-
Actual – Actual spending to date
-
Forecast – Projected future spending
This view helps detect over/under-spending and supports forecast adjustments.
🎯 Strategic Objectives – Detailed View
Understand how your investment portfolio aligns with strategic goals.
Metrics include:
-
Target % – Degree of alignment to each objective
-
Allocated – Investment allocated to each objective
-
Requested – Investment originally requested
-
In Progress – Investment tied to ongoing initiatives
-
Total – Cumulative view per objective
📂 Full Portfolio Data View
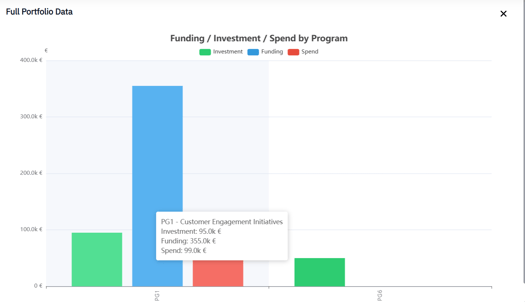
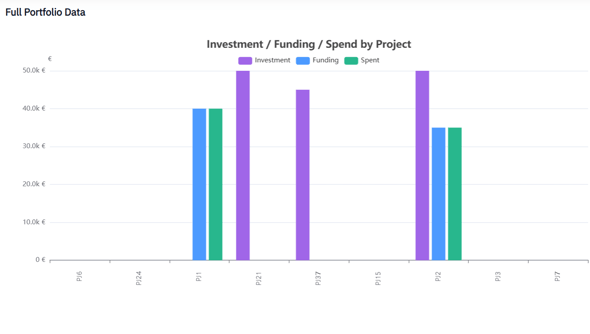
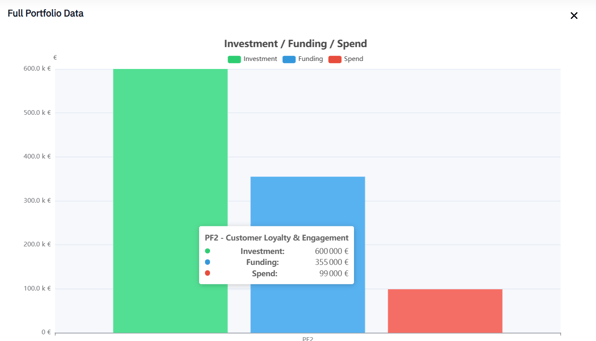
Gain complete transparency over all financial data, with the ability to analyze at three levels:
▸ By Program
-
Investment
-
Funding
- Spend
▸ By Project
-
Investment
-
Funding
-
Spend
▸ Aggregate View
-
Consolidated investment, funding, and spend data across the entire portfolio
✅ Summary
AIZOPlan’s Investment Planning dashboards offer real-time insights to drive better financial decisions at the portfolio level. With visibility into performance indicators like CPI, SPI, budget utilization, and strategic alignment, portfolio leaders can:
-
Monitor execution efficiency across programs and projects
-
Detect financial risks early and adjust forecasts proactively
-
Ensure funding is directed toward the most valuable initiatives
-
Align investment decisions with strategic business goals
These dashboards provide the clarity needed to manage your portfolio with confidence and agility.