
The Strategy Dashboard consolidates four complementary views to provide end-to-end visibility from strategy to execution:
-
Financial Performance
-
Risk Performance
-
Strategy Performance
-
Project Performance
Each view can be displayed:
-
Across all Strategic Goals for global execution visibility, or
-
Focused on a single Strategic Goal for a targeted view of its initiatives and outcomes.
🔍 Overview - Risk Performance
The Risk Performance Dashboard provides executives with a unified, end-to-end view of risk exposure across:
-
Strategy
-
Portfolios
-
Programs
-
Projects
It transforms risk management into a predictive and proactive discipline, ensuring that emerging risks are detected early and cannot silently derail strategic outcomes.
📌 Access the Project Performance Dashboard
- Navigate to the main menu: Strategy > Track > Strategy Dashboard
Then select Risk Performance from the list of Dashboards.
You may switch between:
-
All Strategic Goals to view global execution, or
-
Any single Strategic Goal to focus on its specific initiatives
📌 Explore the Risk Performance components
1️⃣ Total Risk Exposure (Trend Analysis)
This trend chart shows how enterprise-wide risk exposure evolves over time, consolidating risks from portfolios, programs, and projects.
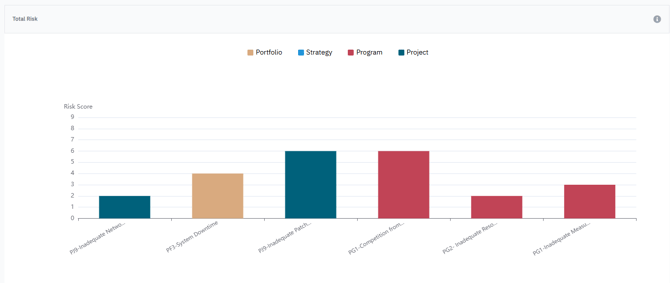
Use this view to:
-
Detect early warning patterns
-
Compare risk evolution between portfolios/programs/projects
-
Validate the impact of mitigation plans
-
Prioritize areas showing rising exposure
-
Support crisis response planning
2️⃣ Risk Matrix (Likelihood × Impact)
AIZOPlan automatically maps all risks into a 3×3 severity matrix, combining likelihood and impact. Risks are shown at each management level (Portfolio, Program, Project).
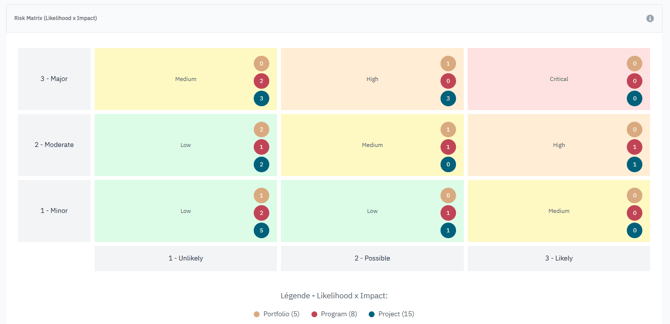
Severity zones:
-
🔴 7–9 → Critical — Immediate executive action
-
🟠 5–6 → High — Increased monitoring
-
🟡 3–4 → Medium — Follow-up needed
-
🟢 1–2 → Low — Normal monitoring
Use this matrix to:
-
Identify concentration of high-severity risks
-
Understand whether risks originate at strategic or operational layers
-
Prioritize mitigation resources
-
Monitor risk evolution and interdependencies
3️⃣ Top 5 Risks — Ownership & Mitigation Status
This widget highlights the five highest-exposure risks across all levels.
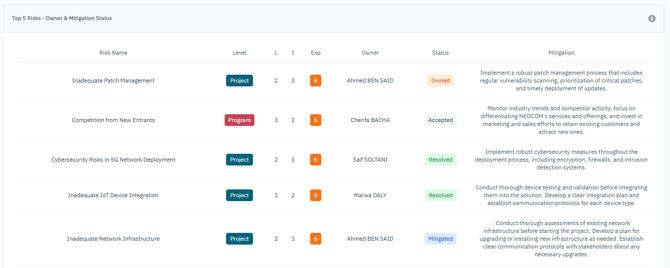
For each risk, it displays:
-
Risk owner
-
Likelihood
-
Impact
-
Exposure score
-
Mitigation status
-
Trend
Use this view to:
-
Identify the most threatening risks
-
Ensure accountability and clear ownership
-
Assess the effectiveness of mitigation plans
-
Escalate risks requiring executive support
✅ Summary
The Risk Performance Dashboard enables organizations to:
-
Maintain continuous visibility into risk exposure
-
Escalate critical risks faster
-
Allocate mitigation resources more effectively
-
Strengthen strategic resilience
With AIZOPlan, risk management evolves from reactive firefighting to predictive strategic protection, ensuring strategy execution remains resilient and controlled.