
The Strategy Dashboard consolidates four complementary views to provide end-to-end visibility from strategic intent to execution:
-
Financial Performance
-
Risk Performance
-
Strategy Performance
-
Project Performance
Each view can be displayed:
-
Across all Strategic Goals for global execution visibility, or
-
Focused on a single Strategic Goal for a targeted view of its initiatives and outcomes.
🔍 Overview - Strategy Performance
The Strategy Performance Dashboard provides executives and strategic leaders with a real-time, comprehensive assessment of strategic execution across Strategic Themes, Strategic Objectives, and Key Results (KRs).
It helps leaders answer the most critical question:
Is our strategy progressing as expected — and where do we need to intervene?
By consolidating all strategic performance signals, AIZOPlan clearly reveals:
-
What is on track
-
What is lagging
-
Where support or corrective action is required
This transforms strategy tracking into an active governance discipline rather than a passive reporting exercise.
📌 Access Strategy Performance Dashboard
Navigate to the main menu: Strategy > Track > Strategy Dashboard
Then select Strategy Performance from the list of Dashboards.
You may switch between:
-
Across all Strategic Goals, or
-
Focused on one selected Strategic Goal
📌 Explore the Strategy Performance Components
1️⃣ Strategic Theme Performance
This view displays the performance of each Strategic Theme by aggregating the results of its associated Strategic Objectives
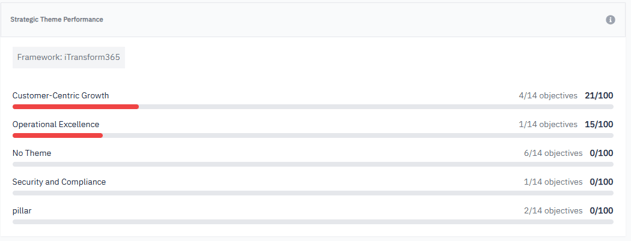
Use this view to:
-
Identify high- and low-performing strategic areas
-
Detect execution gaps early
-
Reorient resources or leadership focus
-
Validate that the strategy is progressing at the right pace
2️⃣ Strategic Objective Performance
Each tile represents a Strategic Objective, with its performance score calculated from all linked Key Results.
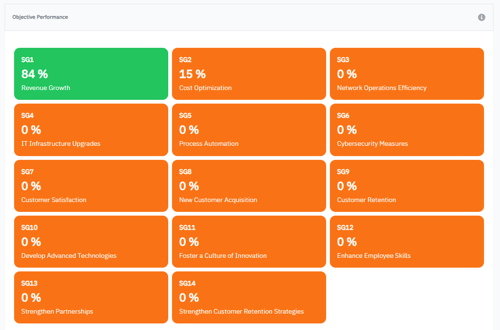
Color indicators:
-
🟢 80–100% → On track
-
🟡 40–79% → Needs monitoring
-
🟠🔴 0–39% → Off track, requires action
Use this view to:
-
Detect where execution is slowing
-
Trigger focused intervention
-
Guide budget or capacity reallocations
-
Ensure alignment between strategic plan and execution
3️⃣ All Key Results (KR) Performance
This view consolidates all Key Results linked to the selected Strategic Goal, displaying :
-
KR performance (% progress toward target)
-
Days remaining (urgency level)
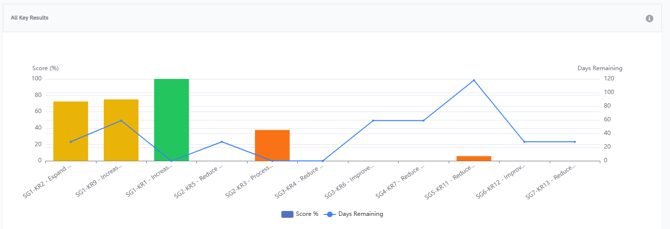
Interpretation guide:
| Pattern | Meaning |
|---|---|
| High score + many days left | Strong performance, low risk |
| High score + few days left | Efficient execution nearing success |
| Low score + few days left | High risk → immediate action needed |
| Variable scores across KRs | Uneven prioritization or execution bottlenecks |
Use this view to:
-
Track KR progress across the organization
-
Detect stagnant KRs early
-
Prioritize corrective actions
-
Validate alignment with strategic ambition
4️⃣ Linked Strategy Score
The Linked Strategy Score provides a consolidated indicator of overall strategic health.
It combines:
-
Theme progression
-
Objective and KR performance
-
Pace of execution vs. remaining time
Use this view to:
-
Assess whether the strategy is on trajectory
-
Identify where performance is drifting
-
Support executive reporting and reviews
-
Guide adjustments to keep the strategy on track
✅ Summary
The Strategy Performance Dashboard provides leaders with:
-
Real-time visibility into strategic execution
-
Clear performance signals at every level
-
Early identification of gaps and risks
-
A unified score to support executive decisions
With AIZOPlan, strategic monitoring evolves into proactive strategic governance, ensuring that every objective is supported, delivered, and measured.